Reviewers criticised 12 of the 17 TAM SAM SOM slides they judged in this library, and each of the 12 started from an industry total or claimed a share of one. TAM, SAM and SOM stand for total addressable market, serviceable available market and serviceable obtainable market. The TAM is everyone who could ever pay for what you sell, the SAM is the part you can reach with your product and channels, and the SOM is the part you expect to win in the next few years. The slide tells an investor whether the market is big enough to return the fund, and whether the founders know where their first customers come from.
How I counted
When I counted in November 2026, the library had 171 decks. I kept the 25 market slides that name TAM, SAM or SOM, call their sizing top-down or bottom-up, or name a beachhead market. They come from 21 decks, and 17 of the slides carry a verdict. 16 of those 17 verdicts come from TechCrunch's pitch deck teardowns and Persuade & Raise breakdowns, so this is two sets of reviewers' taste.
TAM SAM SOM slides reviewers criticised
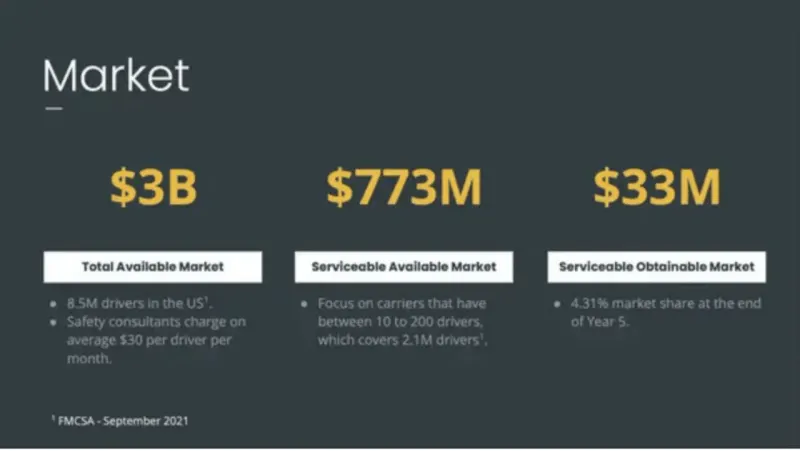
The sharpest notes went to slides whose SOM was a percentage of a big industry number. LogRock showed a $3B TAM, a $773M SAM and a $33M SOM, the last one being "4.31% market share at the end of Year 5". The reviewer's note on that slide: "When building a market slide, work your way up, not down. […] Don't start from market size and claim you can capture 5% of the market". LogRock's TAM was itself built from a count, 8.5M US drivers at $30 a month. It was the share-of-market SOM that drew the note.
The bigger the share, the sharper the note. Mi Terro went from a $128.8B single-use plastic market to a $1B SOM at "20% of total market share (2030)". The note: "TAM/SAM/SOM - now prove it!" Tanbii put a $891B global carbon market above a $7.13B SOM labelled "80% Total of Market Share". The note: "That's a hella big market!", under the heading "A huge market, yes, but not the way Tanbii thinks". Glambook expected "a share of up to 30%" of 2 million beauty specialists in Europe and the UK, and got a one-line note: "A top-down market sizing."
Other slides showed industry totals with no path to the company. Keyway showed "$5T+ properties in stock" and "$300B+ yearly mid-market CRE transactions". The reviewer's note: "These market slides that share massive industry numbers tend to scare away investors. It would be best if you always were working from the bottom up." Della put a $1 billion TAM, a $2 billion legal AI market by 2026, 60,000 large businesses and 2.3 million lawyers on one slide. The note: "The numbers here are a little crazy; I'd have preferred a bottom-up approach instead of this top-down approach to explain the market." Glow Labs led with NFT sales reaching $17.7 billion, and the note asked for something else: "I much rather they explain how they will get their first customers and how much revenue they can make from them".
On some slides the circles didn't connect. Supliful drew a $7.9T TAM, a $2.6T SAM and a $1.2B SOM next to 120M creators, 40M in the US and 200K in its first vertical. The heading on the review was "Explain the TAM/SAM/SOM more", and the note said "The market size slide is a bit hand-wavy." Netmaker nested $3.6B inside $60B cloud networking inside $1000B cloud computing ("That's a huge market! But wait…"). MiO Marketplace titled its slide Total Addressable Market and filled it with $600B+ of ad spend, 600,000+ ad execs and a table of ARR at 0.5% to 10% penetration. The note: "This slide is labeled TAM, but it includes everything but that." BoxedUp listed a $335 billion sharing economy around a $9 billion production rental market, and the reviewer said "I'd argue the real TAM is the $9 billion production rental equipment number."
One deck used too many slides. Nokod Security spent three slides on TAM. The middle one averaged a Gartner and an Acumen forecast to $26.72B, then assumed 15% for security to land on $4B. The note: "One of three (!) TAM slides."
All 21 decks in this sample raised their round. A criticised market slide didn't stop any of these companies from closing.
TAM SAM SOM slides reviewers praised
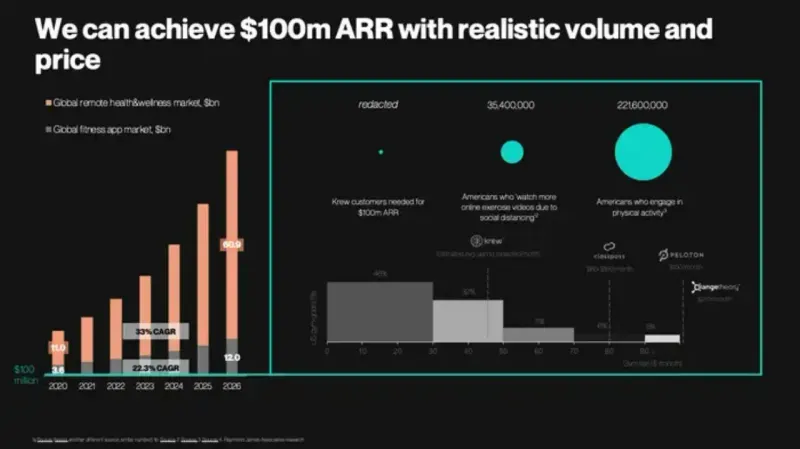
Reviewers praised 5 of the 17 judged slides, and 4 of the 5 counted customers or named a first segment. Krew titled its slide "We can achieve $100m ARR with realistic volume and price". It set the number of customers it needed against 35.4 million Americans who watch online exercise videos and 221.6 million who exercise. The reviewer's note: "Working your way up from $0 always makes the forecasted ARR much more believable than when you name the market size and claim you can capture 10%."
Incymo AI wrote the formula on the slide. Its $71.5B TAM is (477,998 + 1,012,065) apps × $4k × 12 months, and its $28.8M SOM is 600 × $4k × 12, with the 600 taken from its own CRM. The note was short: "That's a huge TAM." It is still a big number, but you can check every part of it.
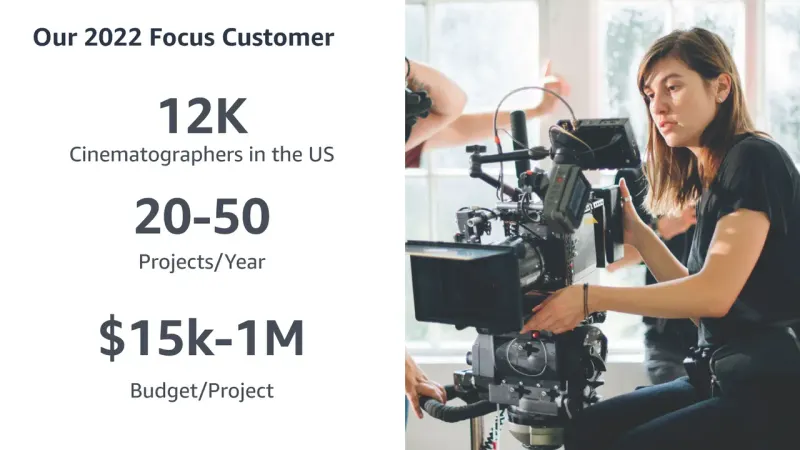
The same BoxedUp deck that was marked down for its $335 billion circle got praised for a beachhead slide. It counted 12K cinematographers in the US, 20 to 50 projects a year, and $15k to $1M budget per project. The heading on the review called it "An excellent illustration of bottom-up market sizing", and the note said "BoxedUp makes the point that it has a huge beachhead market."
Geodesic.Life narrowed from EUR 91.2 bln globally to EUR 5.4 bln in Scandinavia. From there it went to EUR 560 mln in the Stockholm area and EUR 390 mln for turn-key prefab. The note: "A great, clearly defined beachhead market is a good way to get a toehold for your business."
The fifth used no TAM, SAM or SOM at all. Huddle used one sentence: "Experiences sell products. A lot of them. (like $500B a year of them)". The founder wrote the note on that slide, so read it as the author's own view: "Instead of showing a boring & forgettable graph or some nonsensical TAM/SAM/SOM, we manage to convey a large market in a conversational way."
How do you calculate TAM, SAM and SOM?
Count the customers you can reach and multiply by what each one pays, the method 3 of the praised slides used. These are the steps I'd follow:
- Count customers and multiply by price. Krew, Incymo and BoxedUp's beachhead slide all did, and each was praised.
- Name the first segment you'll sell to and give its size, the way BoxedUp and Geodesic.Life did.
- Leave out any SOM that is a percentage of the market. LogRock at 4.31%, Mi Terro at 20%, Glambook at 30% and Tanbii at 80% all did that, and all were criticised.
- Put the math on the slide, so the TAM can be checked rather than taken on trust.
- Keep it to one slide. Nokod's three TAM slides were noted for exactly that.
How many pitch decks have a market slide
74% of the 170 decks that had a full slide list then have a market slide, and it first appears at slide 6 in the median deck. The library held 203 market slides across 128 decks. Reviewers gave a verdict on 66 of them, praising 31 and criticising 35.
| Stage | Decks with a market slide |
|---|---|
| Angel and pre-seed decks | 83% (50 of 60) |
| Seed decks | 69% (76 of 110) |
Pre-seed decks have one more often than seed decks. The page on pitch deck slide order shows where the market slide sits among the others. If you're still deciding how long the whole deck should be, I counted that in how many slides a pitch deck should have. All 21 decks above are in the full library of startup pitch deck examples.
The line I'd copy is Incymo's SOM, 600 × $4k × 12, with the 600 taken from its own CRM. Every market slide in the library, with its image and reviewer note, is on the market slide examples page.